Overview of Causal Inference Methods
ECON526
One Question, Many Methods
\[ % \def\Er{{\mathrm{E}}} \def\En{{\mathbb{E}_n}} \def\cov{{\mathrm{Cov}}} \def\var{{\mathrm{Var}}} \def\R{{\mathbb{R}}} \newcommand\norm[1]{\left\lVert#1\right\rVert} \def\rank{{\mathrm{rank}}} \newcommand{\inpr}{ \overset{p^*_{\scriptscriptstyle n}}{\longrightarrow}} \def\inprob{{\,{\buildrel p \over \rightarrow}\,}} \def\indist{\,{\buildrel d \over \rightarrow}\,} \DeclareMathOperator*{\plim}{plim} \def\indep{{\perp\!\!\!\perp}} \]
How does tutoring affect graduation rates?
- The students who choose tutoring may be different from the students who do not.
- A simple difference in graduation rates is not automatically a causal effect.
- Causal inference requires a credible comparison for what would have happened otherwise.
What could make a comparison credible?
The question
Does tutoring increase graduation?
- Treatment: tutoring
- Outcome: graduation
- Population: students eligible for tutoring
The missing comparison
For tutored students, we observe graduation with tutoring.
We do not observe how those same students would have done without tutoring.
Every method below proposes a different way to build that counterfactual.
Where Does Identification Come From?
A field guide
| Method | Compare… | Key idea |
|---|---|---|
| Experiment | randomly assigned groups | assignment breaks selection |
| Regression / matching | similar observed students | adjust for observed differences |
| Difference in differences | changes over time | comparison group captures the trend |
| Synthetic control | treated place vs. weighted donor places | match the pre-treatment path |
| Instrumental variables | treatment shifted by an instrument | isolate a plausibly external nudge |
| Regression discontinuity | units just on either side of a cutoff | near-cutoff units are comparable |
Each method relies on assumptions that make its comparison informative about a causal effect. The available data and institutional setting determine what method to use.
Experiments and Observational Comparisons
Random assignment: the clean benchmark
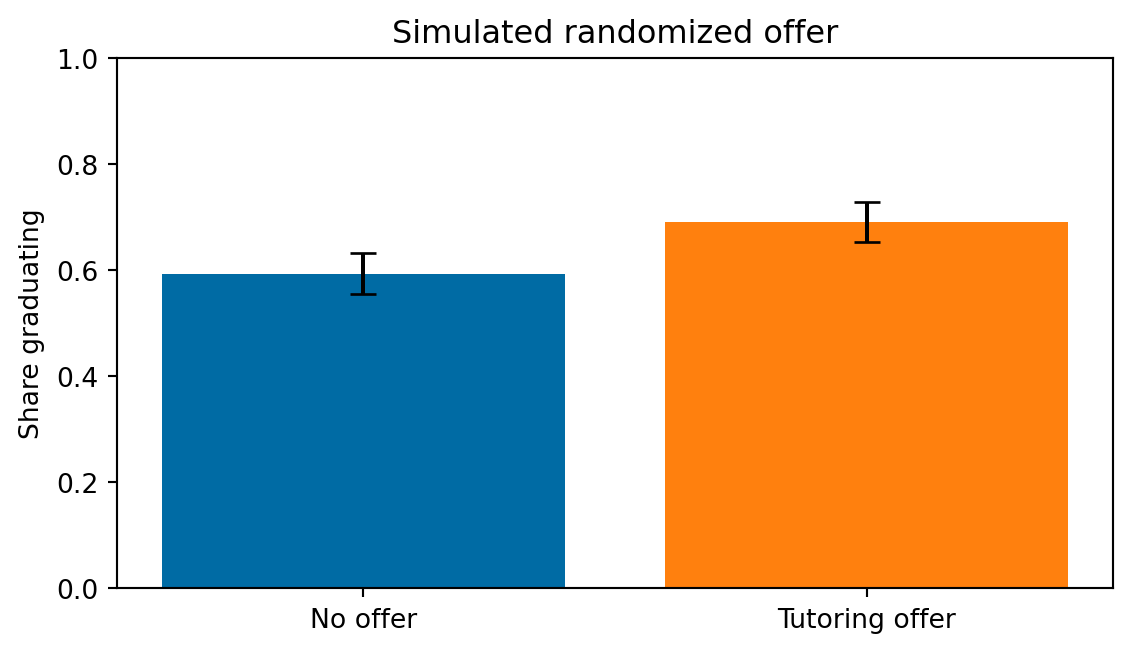
- A school district has more eligible students than tutoring places. It randomly offers places to some students and compares their graduation rates.
Offer of tutoring for randomly selected eligible students
No offer for other eligible students
Because the offer was random, there is no selection bias and the two groups provide a comparison for each other. \[ Y(1), Y(0) \indep D \, \Rightarrow\, \Er[Y(1) | D = 1] - \Er[Y(0) | D = 0] = \Er[Y(1) - Y(0)] \]
The graduation-rate gap estimates the effect of being offered tutoring.
Randomized experiment
Note
Randomization eliminates selection into who receives the offer. It does not eliminate concerns like attrition, noncompliance, or whether results apply to students in other districts.
Regression and matching: make like-with-like comparisons
Tutoring, revisited
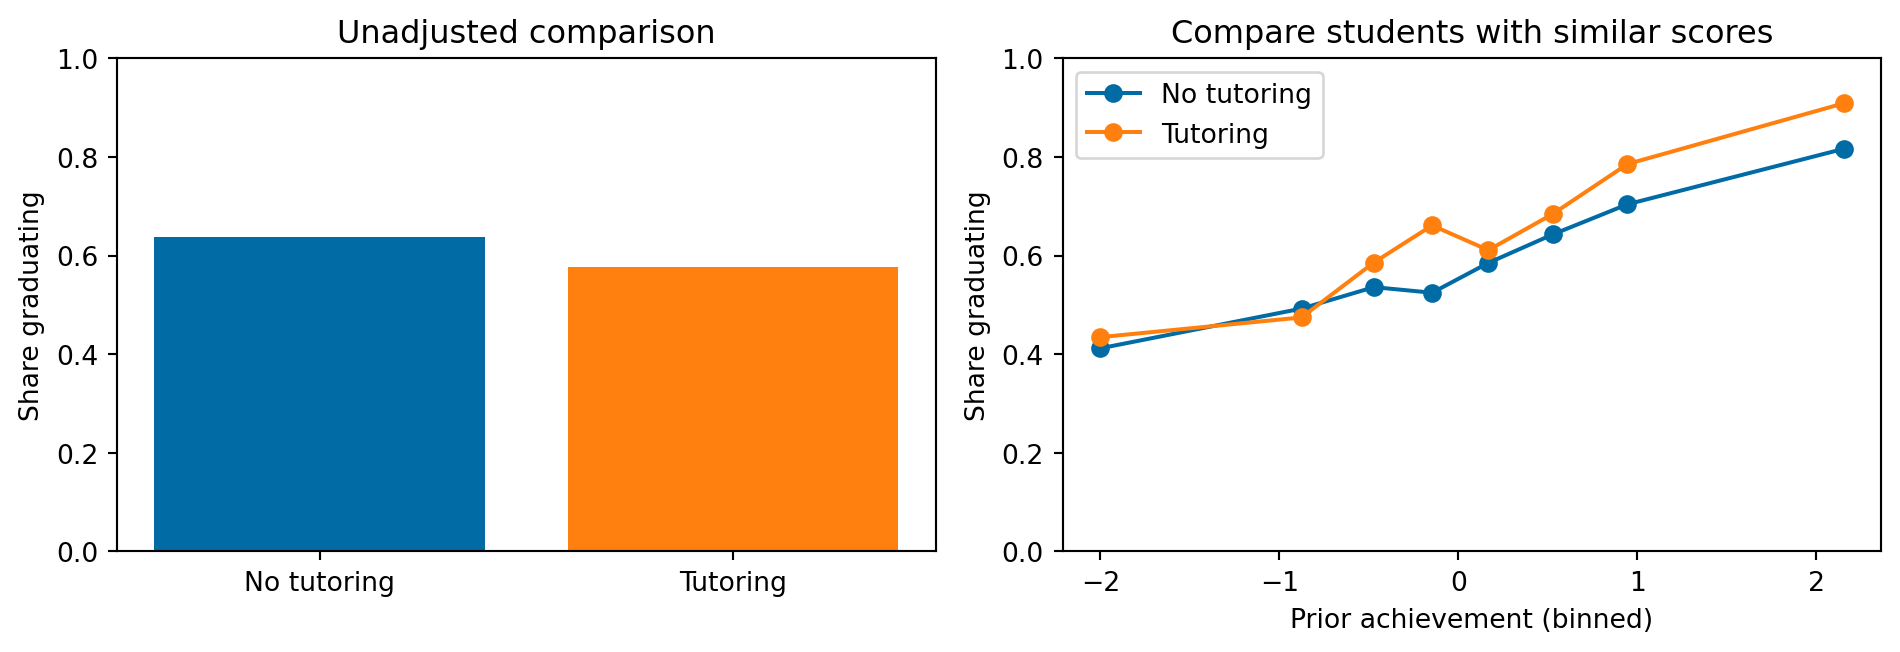
Tutored students often had lower grades before tutoring.
Compare students with similar prior grades and backgrounds — using regression adjustment or matching.
Identification assumption: conditional on observed characteristics, tutoring is as good as randomly assigned. \[ Y(1), Y(0) \indep D | X \]
Question to ask: what important difference is still unobserved?
- All relevant differences should be measured; otherwise, selection on unobserved factors remains even after conditioning on covariates
- Motivation, family support, or a teacher’s private assessment may still affect both tutoring and graduation.
Matching
Variation over Time and Across Places
Difference in differences: compare changes
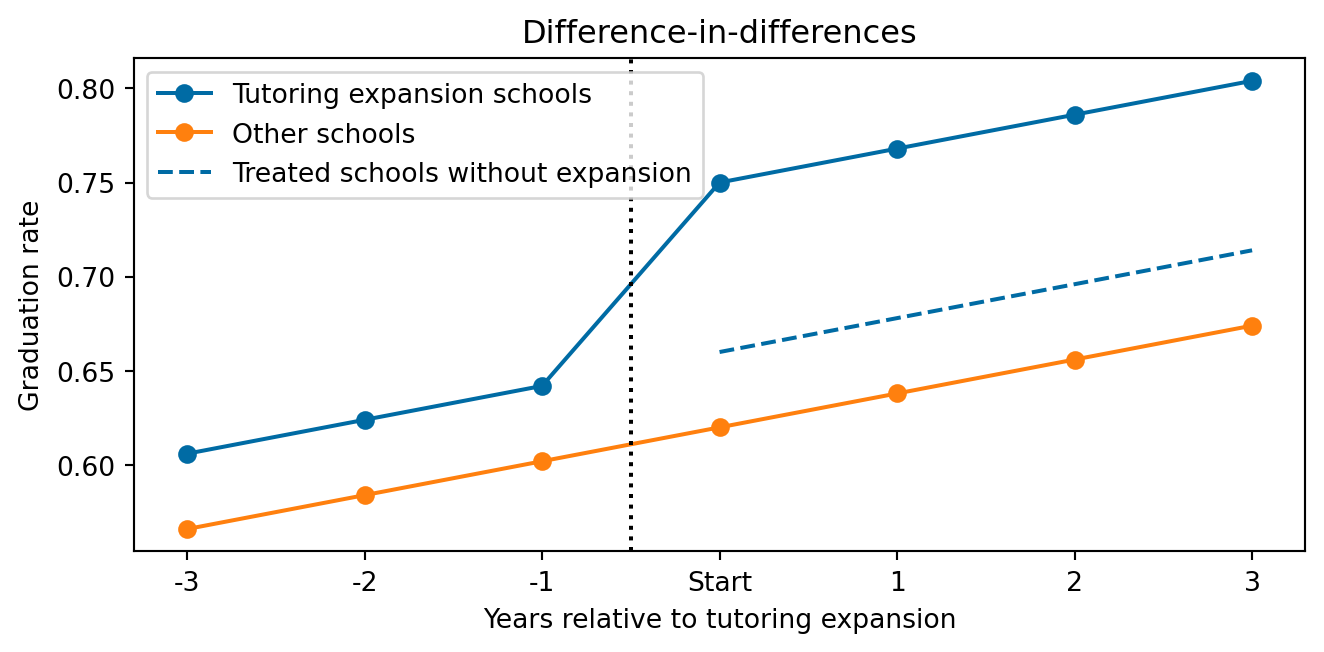
The district expands tutoring in some schools this year, but not in others. Compare graduation rates before and after the expansion:
- Potential outcomes \(Y_{it}(d)\)
- Making these only depend on current \(d\) implies (i) no anticipation and (ii) no spillovers
- Observe \(Y_{it} = Y_{it}(D_{it})\)
- Potential outcomes \(Y_{it}(d)\)
Observed outcomes
| Before | After | |
|---|---|---|
| Expansion schools | \(Y_{i0}(0)\) | \(Y_{i1}(1)\) |
| Other schools | \(Y_{j0}(0)\) | \(Y_{j1}(0)\) |
- Difference in differences:
\[ \underbrace{(Y_{i1}(1)-Y_{i0}(0))}_{\text{treated school's change}} -\underbrace{(Y_{j1}(0)-Y_{j0}(0))}_{\text{comparison school's change}} \]
Difference in differences
Note
Key assumption: parallel trends. Without the expansion, graduation rates in the two sets of schools would have changed similarly. \[ \underbrace{\Er[Y_{i1}(0) - Y_{i0}(0) | D_{i1}=1]}_{\text{unobserved}} = \underbrace{\Er[Y_{i1}(0) - Y_{i0}(0) | D_{i1}=0]}_{\text{observed}} \] - Implies: \[ \begin{align*} \text{DiD} = & \Er[Y_{i1}(1) - Y_{i0}(0) | D_{i1}=1] - \Er[Y_{i1}(0) - Y_{i0}(0) | D_{i1}=0] \\ = & \Er[Y_{i1}(1) - Y_{i0}(0) | D_{i1}=1] - \Er[Y_{i1}(0) - Y_{i0}(0) | D_{i1}=1] \\ = & \Er[Y_{i1}(1) - Y_{i1}(0) | D_{i1}=1] = \text{ATT} \end{align*} \]
Event study
Assessing parallel trends
- Thinking about how treatment was assigned helps assess the plausibility of parallel trends
- Self-selection into treatment can be problematic
- e.g., if schools expanded tutoring because teachers noticed that students were increasingly struggling and expected graduation rates to fall
- \(\Er[Y_{i1}(0) - Y_{i0}(0) | D_{i1}=1] \neq \Er[Y_{i1}(0) - Y_{i0}(0) | D_{i1}=0]\)
- Might show up in pre-treatment trends, if observe \(t=-1\), can check whether \[ \Er[Y_{i,0}(0) - Y_{i,-1}(0) | D_{i1}=1] = \Er[Y_{i,0}(0) - Y_{i,-1}(0) | D_{i1}=0]$ \]
- e.g., if schools expanded tutoring because teachers noticed that students were increasingly struggling and expected graduation rates to fall
- Conditioning can sometimes help
- Conditional parallel trends \[ \Er[Y_{i1}(0) - Y_{i0}(0) | D_{i1}=1, X_i] = \Er[Y_{i1}(0) - Y_{i0}(0) | D_{i1}=0, X_i] \]
Synthetic control: build a comparison district
The district expands tutoring everywhere
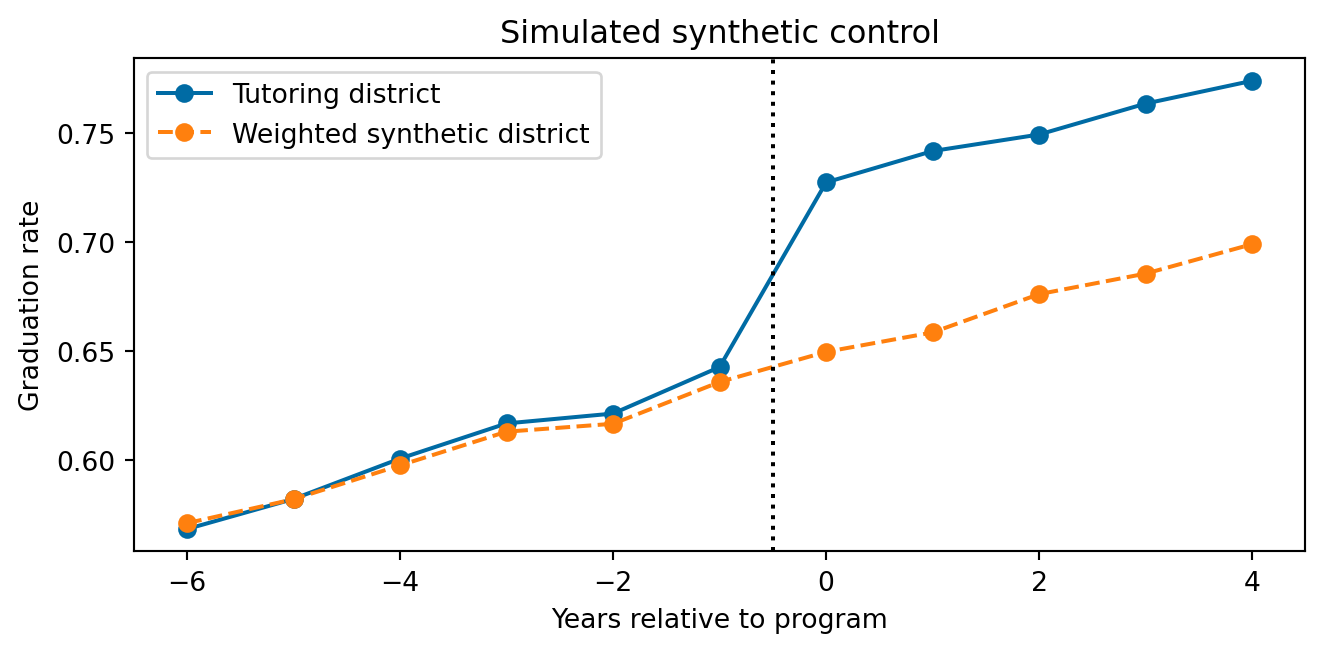
Suppose one district introduces a tutoring program across all its schools at once, and other districts do not. What would graduation rates have been without it?
- Weight other districts to resemble this district before the program.
- Compare its post-program path with this “synthetic district.”
- Treat the post-program gap as an estimated effect—if donor districts provide a credible counterfactual.
Synthetic control
Synthetic control or difference in differences?
Both need panel data with some units treated, others untreated
Synthetic Control:
- best for one or few treated units, many untreated units, many pre-treatment periods
- Assumption: convex combination of untreated units resembles treated unit
- Valid if untreated potential outcome follows a factor model \[ Y_{it}(0) = X_{it}' \beta + \underbrace{\lambda_i' \theta_t}_{\text{unobserved interactive effects (or factors)}} + \epsilon_{it} \]
Difference in differences:
- many treated and untreated units, okay with fewer periods
- Assumption: Parallel trends
Instruments and Cutoffs
Instrumental variables: use an external nudge
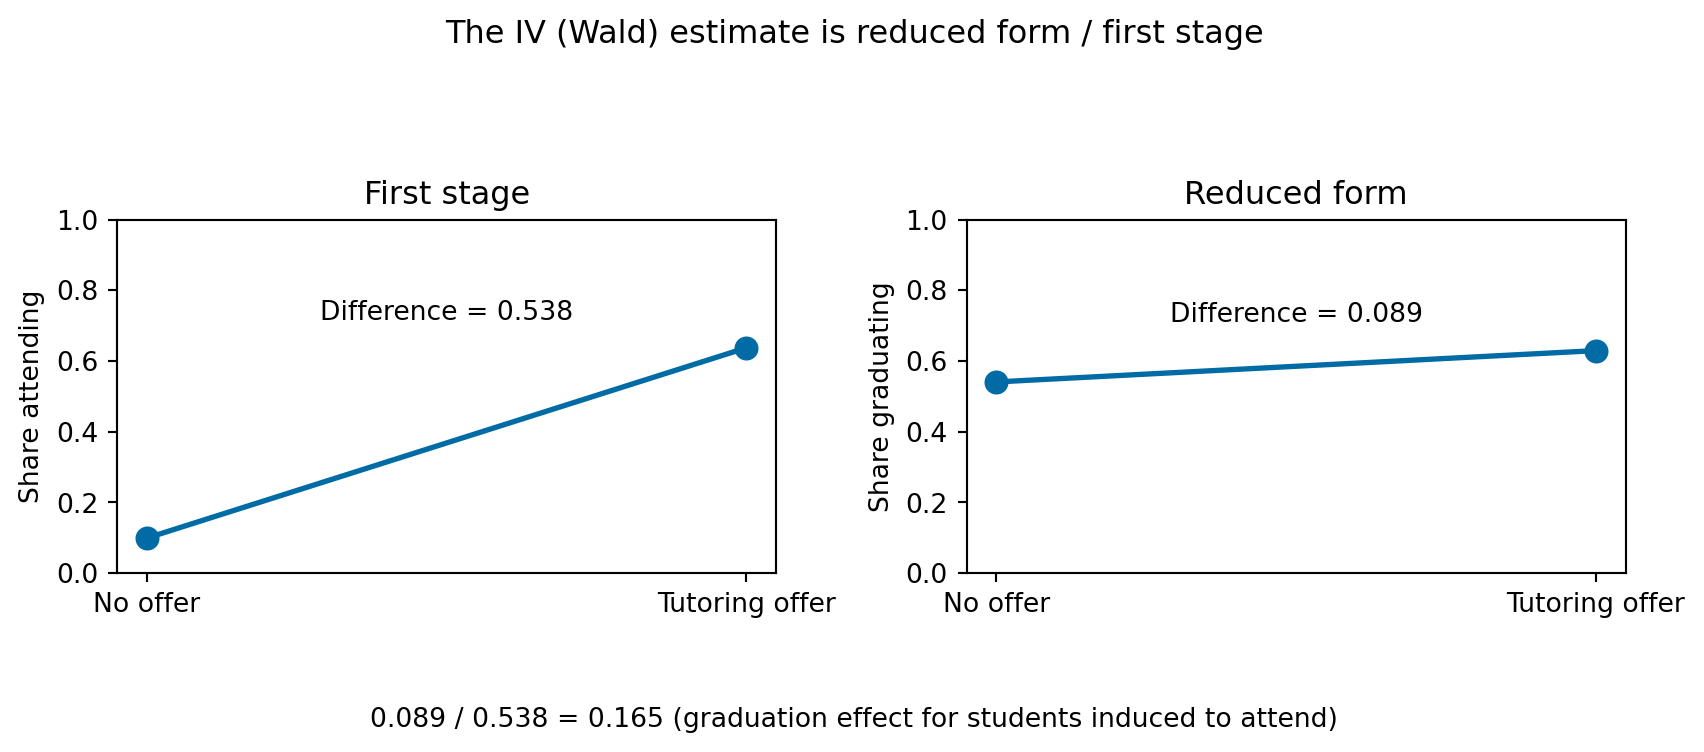
Return to the tutoring lottery: some students offered a place do not attend, while a few students not offered find tutoring elsewhere.
Lottery offer \(\longrightarrow\) tutoring attendance \(\longrightarrow\) graduation
- The offer, \(Z_i\), can instrument for attendance if it changes participation. \[ \cov(Z_i,D_i) \neq 0 \]
- The offer must be unrelated to other causes of graduation. \[ Z_i \indep Y(0), Y(1), D(z) \]
- It must affect graduation through tutoring, not through another channel.
- Potential outcomes are \(Y(D(Z))\), not \(Y(D,Z)\).
IV
Regression discontinuity: compare just around the line
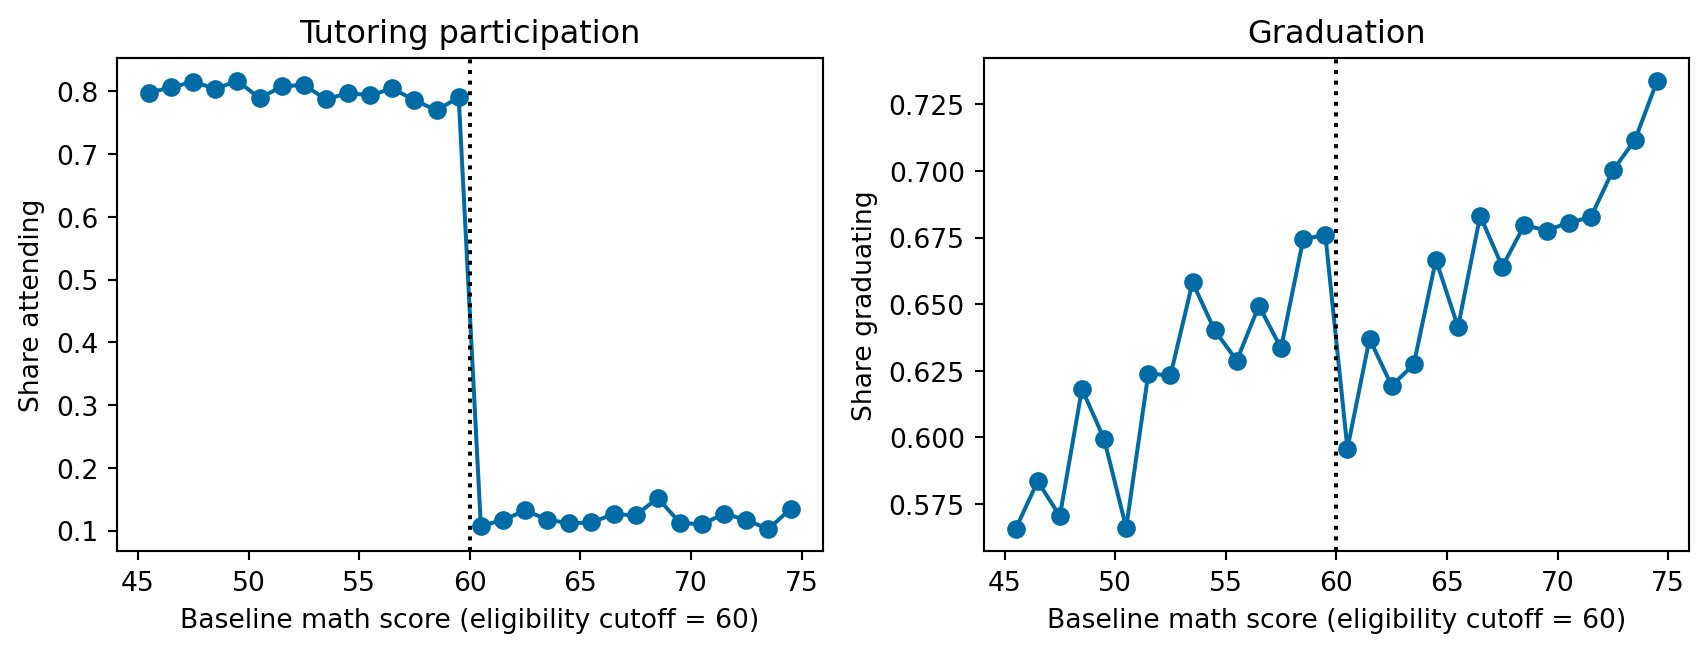
A school offers tutoring to students whose baseline math score is below 60.
Compare students scoring just below and just above 60—not students far apart in preparation.
Why might that work?
Students very close to the cutoff may be similar. If graduation rates would otherwise change smoothly around 60, a jump in graduation identifies the effect.
- Assumption: continuity of \(\Er[Y(1)|R=r]\) and \(\Er[Y(0)|R=r]\)
- Watch for: students or teachers manipulating scores near the threshold. The estimate is local to students around the cutoff.
Regression discontinuity
Flexible Estimation and Effects
Does tutoring help everyone equally?
An average effect can hide important differences:
Ask
Is tutoring more effective for students with weaker prior preparation?
Then check
Can the method identify effects for those groups? Were the groups chosen before looking at results?
I.e. interested in conditional treatment effects, \(\Er[Y(1) - Y(0) | X]\)
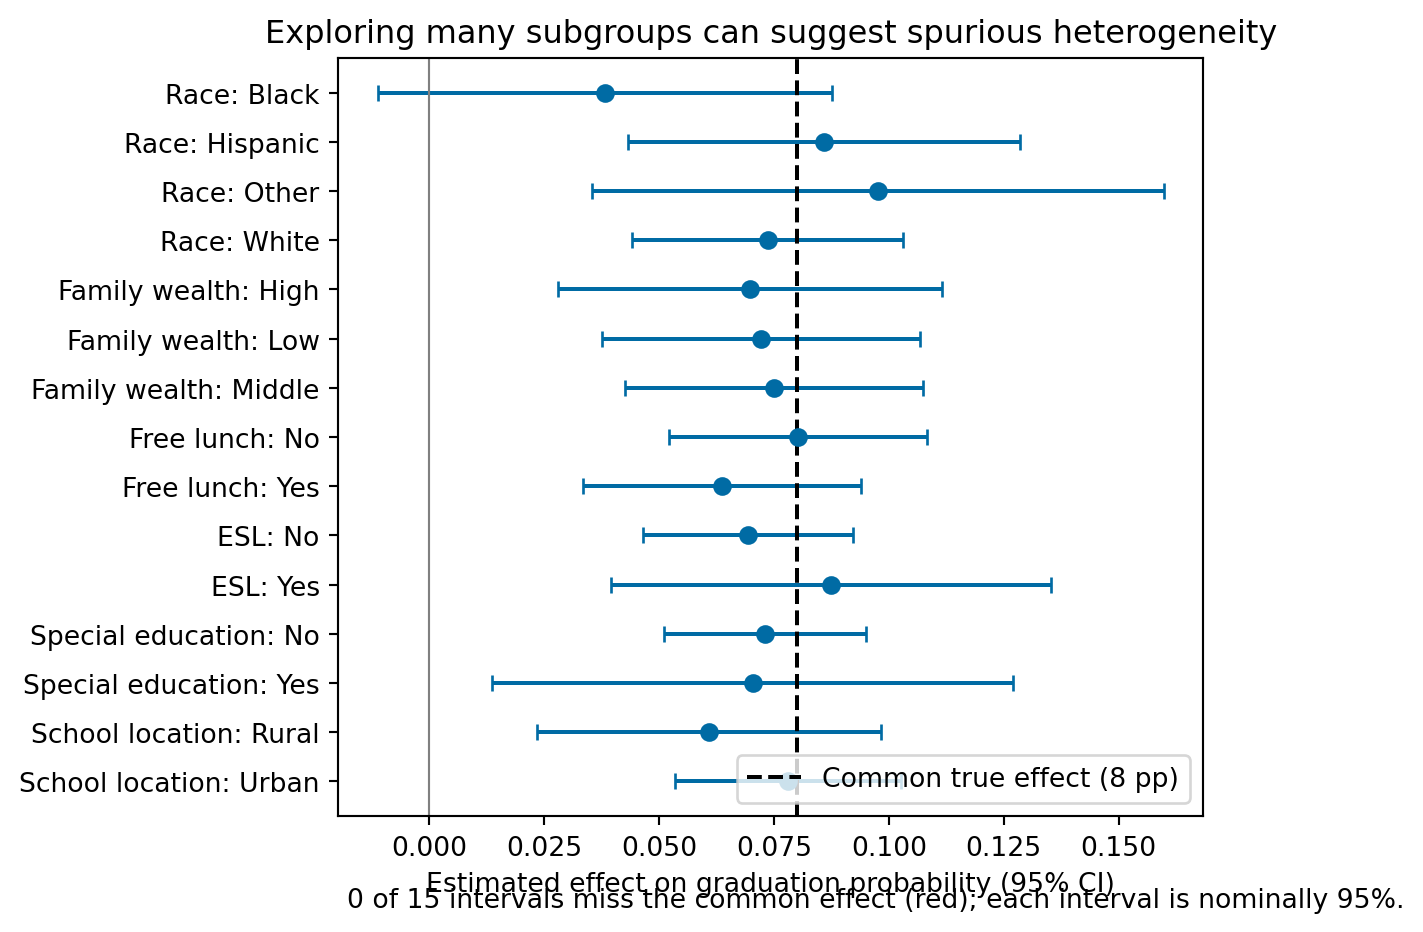
Searching many subgroups can produce impressive-looking patterns by chance. Treat discovered heterogeneity skeptically.
Conditional treatment effects
Simulate a randomized tutoring study where the true effect is the same in every group. Explore 15 categories anyway: some of the nominal 95% confidence intervals may miss the common effect just by chance.
Distribution effects
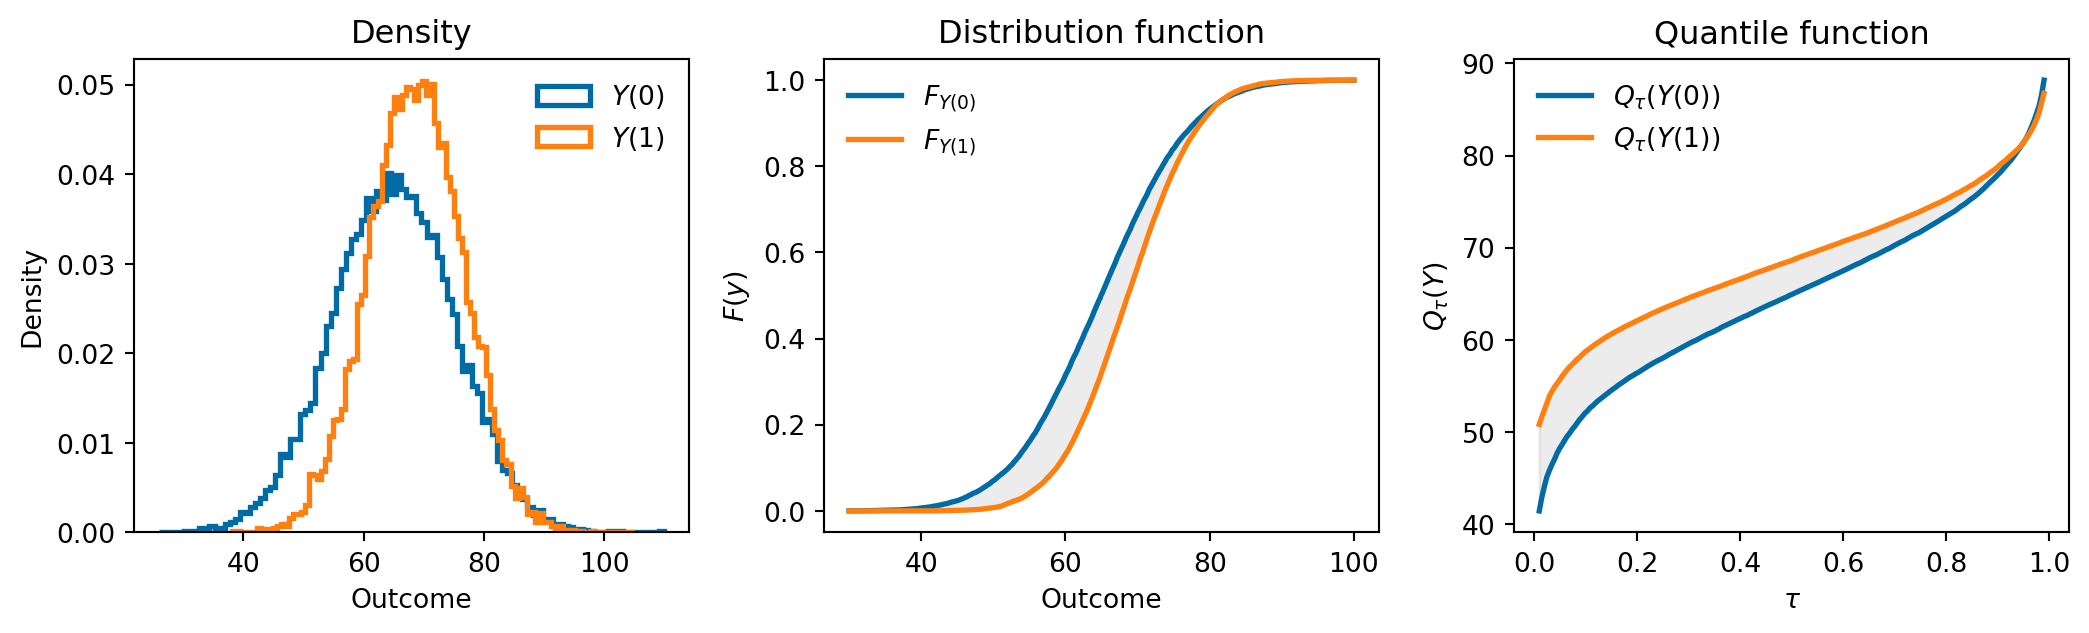
- Instead of (conditional) average effects, we can look at changes in the distribution
- Distribution functions: \(F_{Y(1)}(y) - F_{Y(0)}(y)\)
- Quantiles: \(Q_{\tau}(Y(1)) - Q_{\tau}(Y(0))\)
Simulated potential outcomes, with the effect concentrated at the bottom of the distribution:
Project Proposal
Project proposal — due November 16
Bring a focused causal question
Your proposal should include:
- question
- treatment
- outcome
- data
- comparison / control group
- method
- key assumptions
As we study each method, ask: Could its identifying assumptions be credible for my question and data?
AI Declaration
AI was used for the code and figures in these slides. The first draft of these slides was created by AI based on the other slides. Extensive human editing was required afterward.