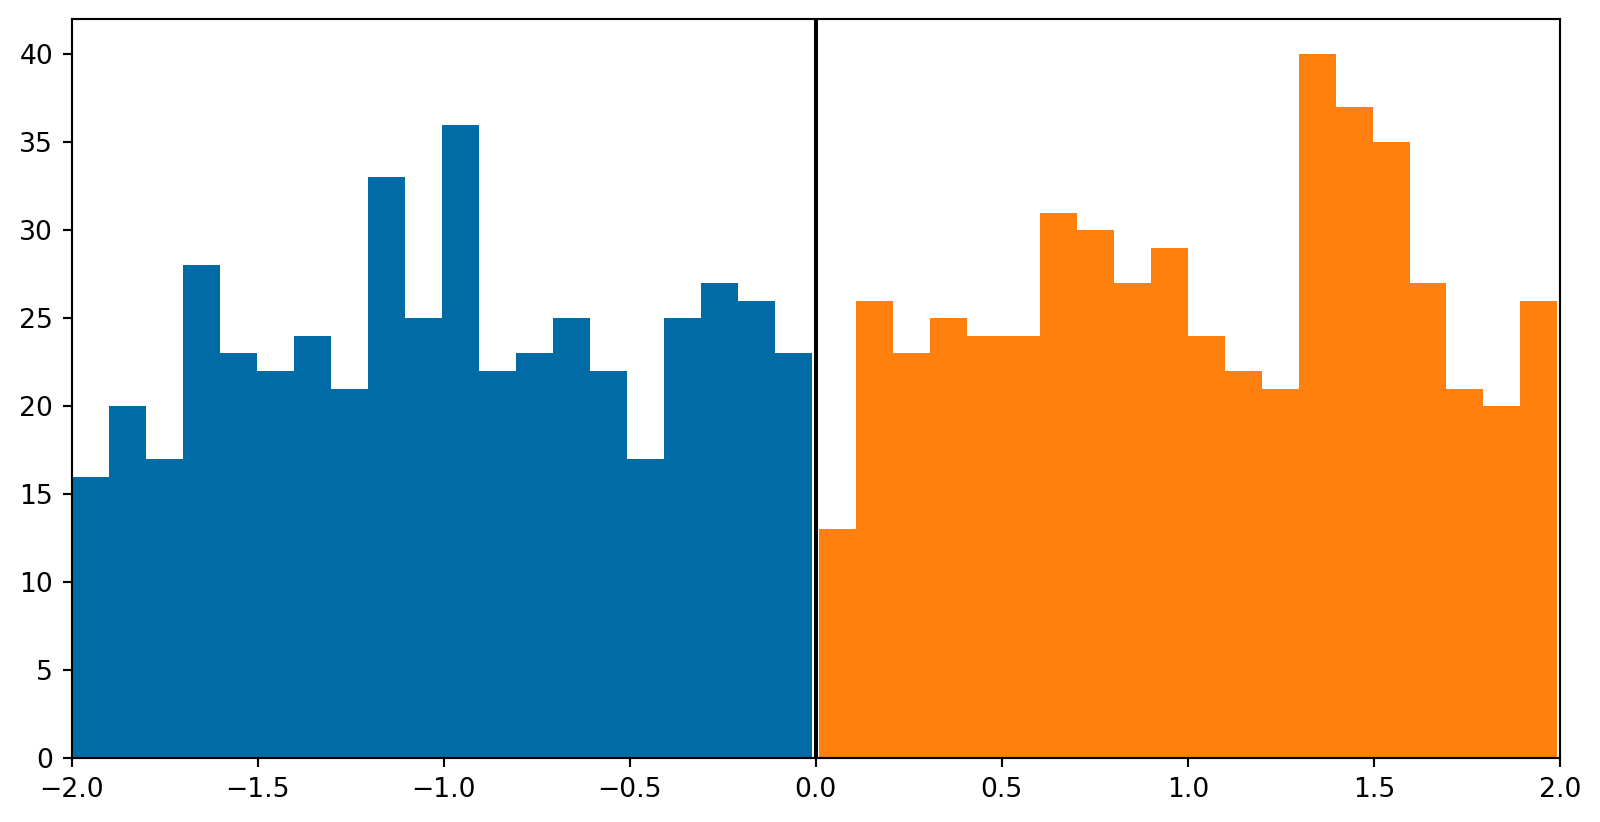
import numpy as np
import matplotlib.pyplot as plt
plt.style.use('tableau-colorblind10')
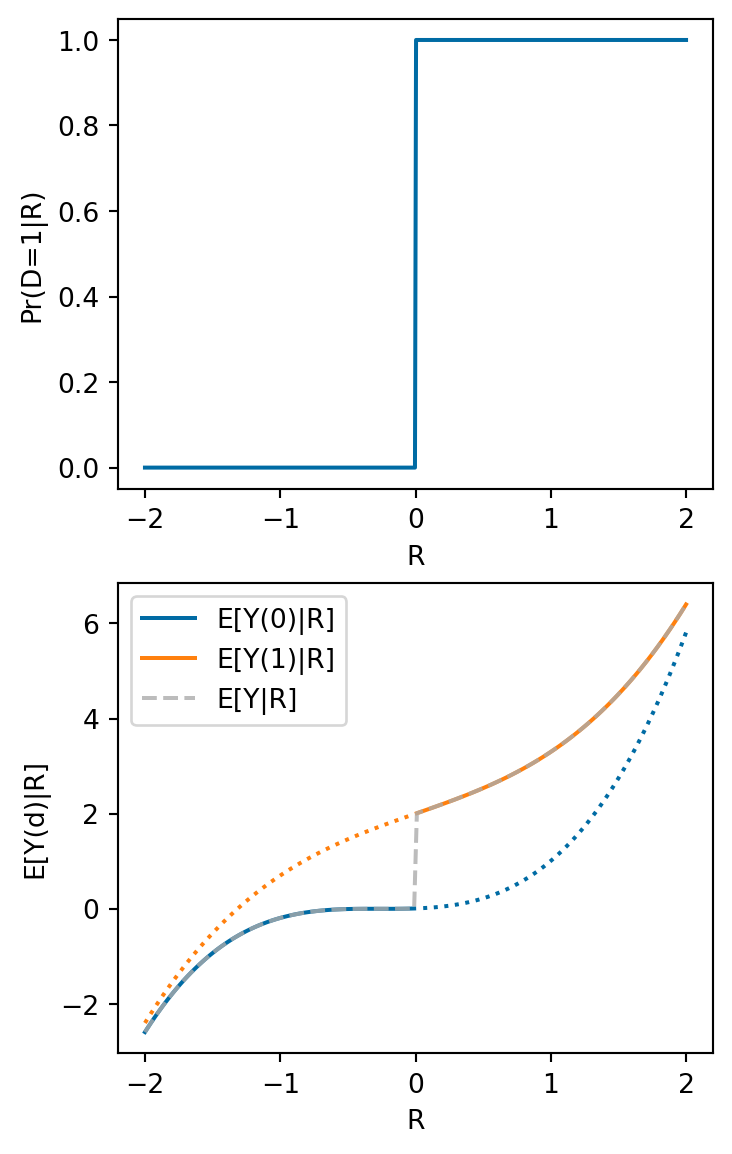
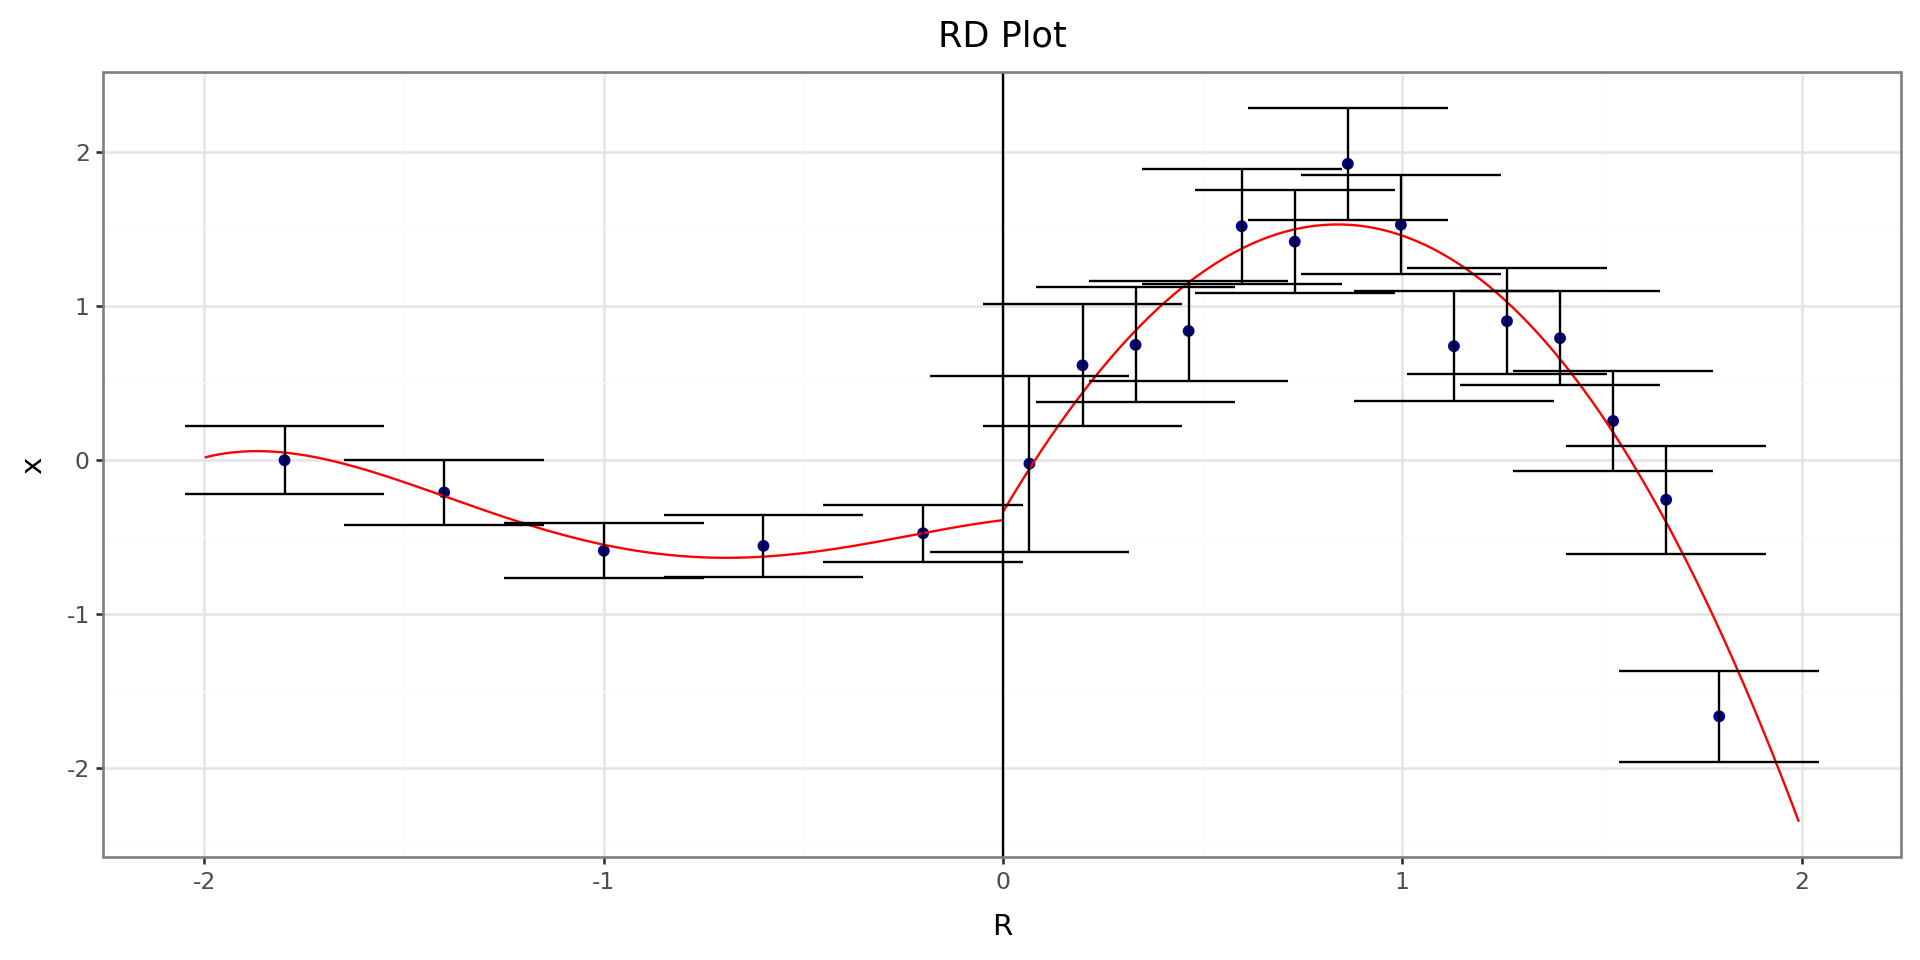
def Ey(d,r) :
if d < 0.1 :
return 0.5*(r+0.2)**3 + 0.1*(r+0.2)**2
else :
return 2 + 0.3*r**3 + r
fig, ax = plt.subplots(2,1, figsize=(4,7))
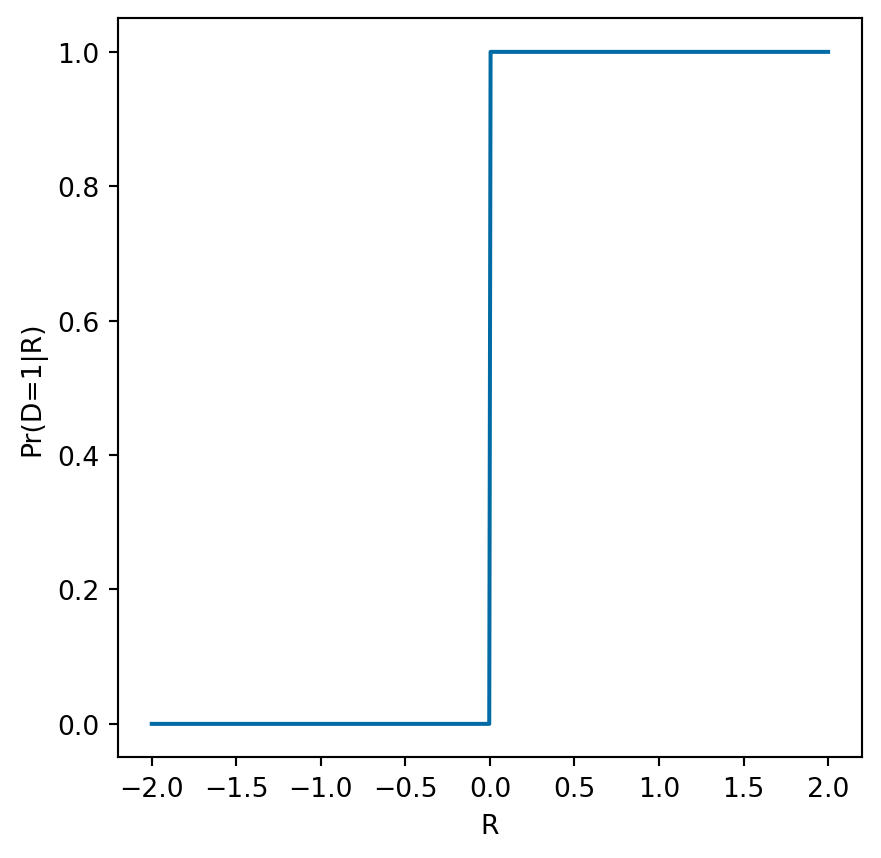
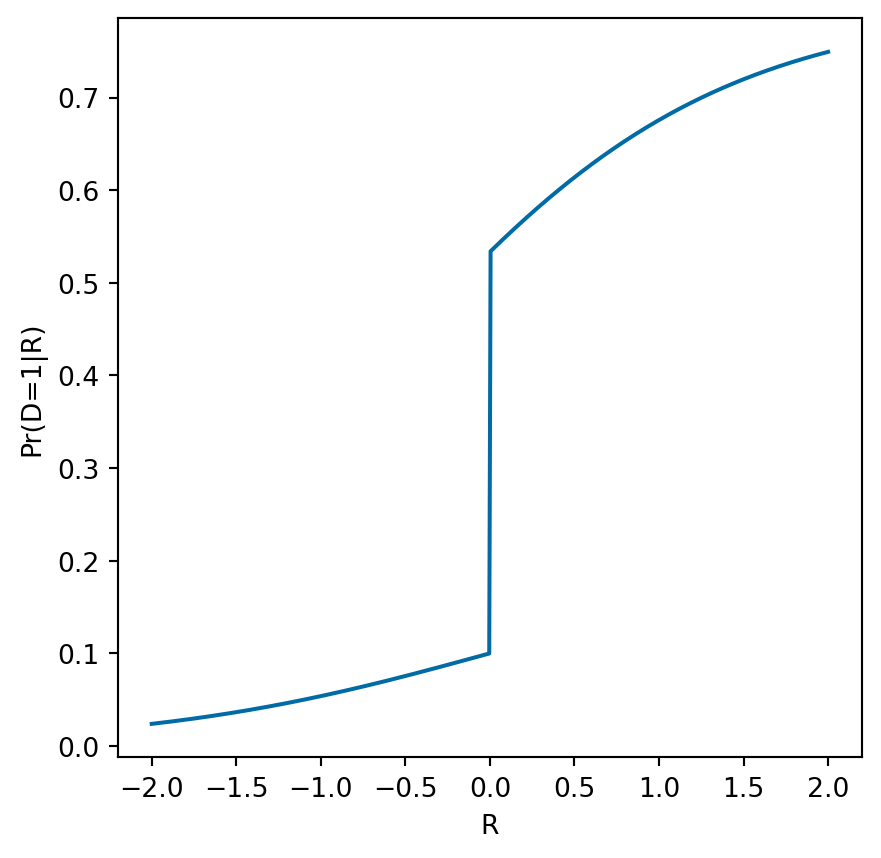
ax[0] = plotp(ax[0],pdr)
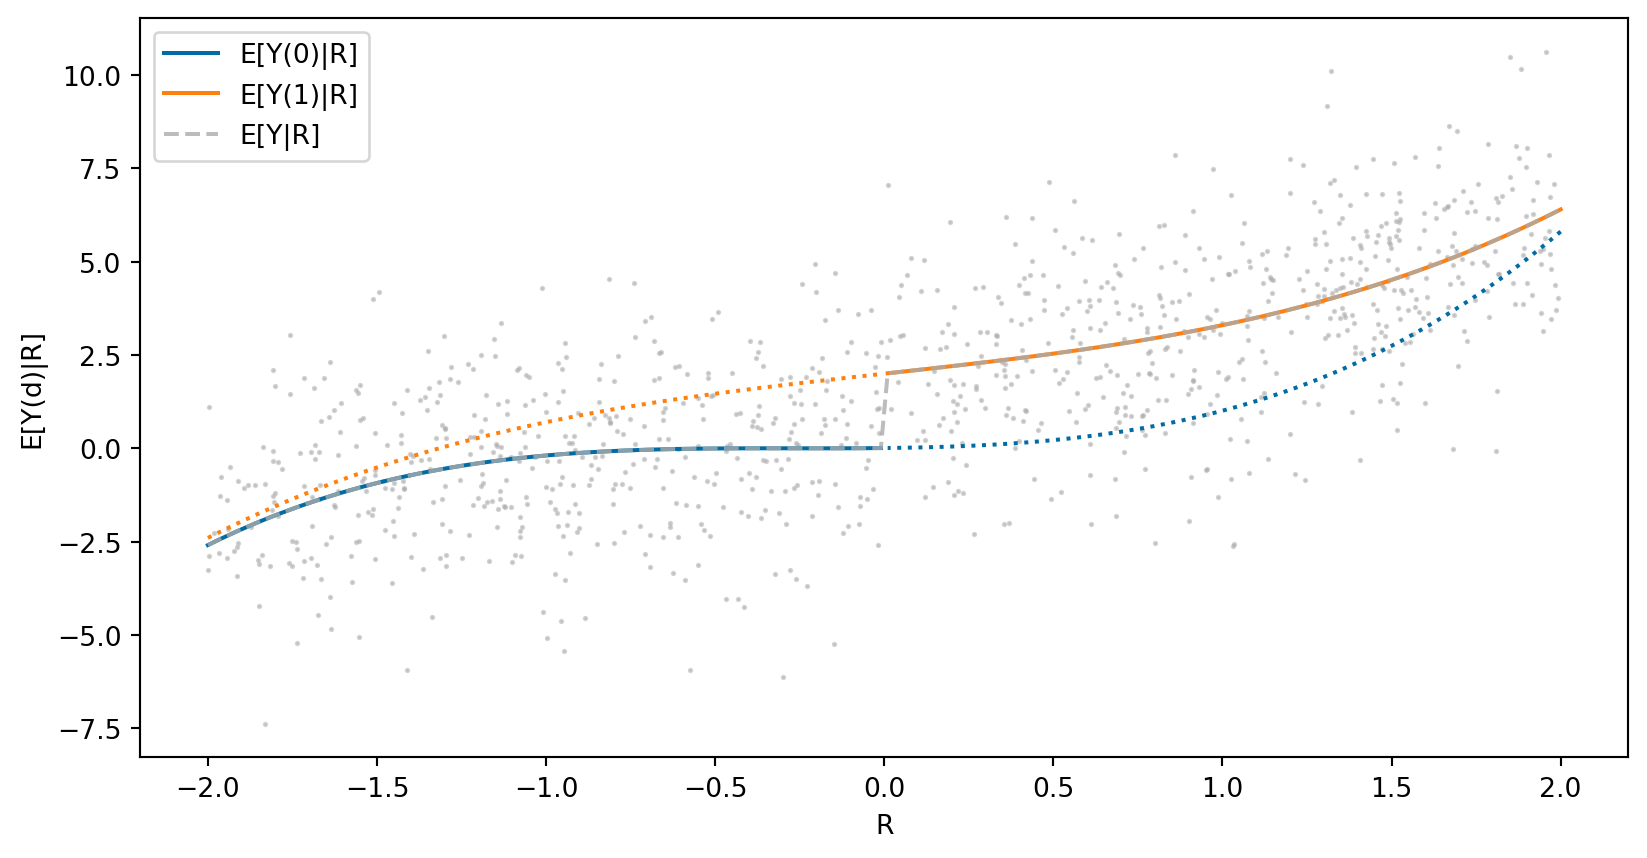
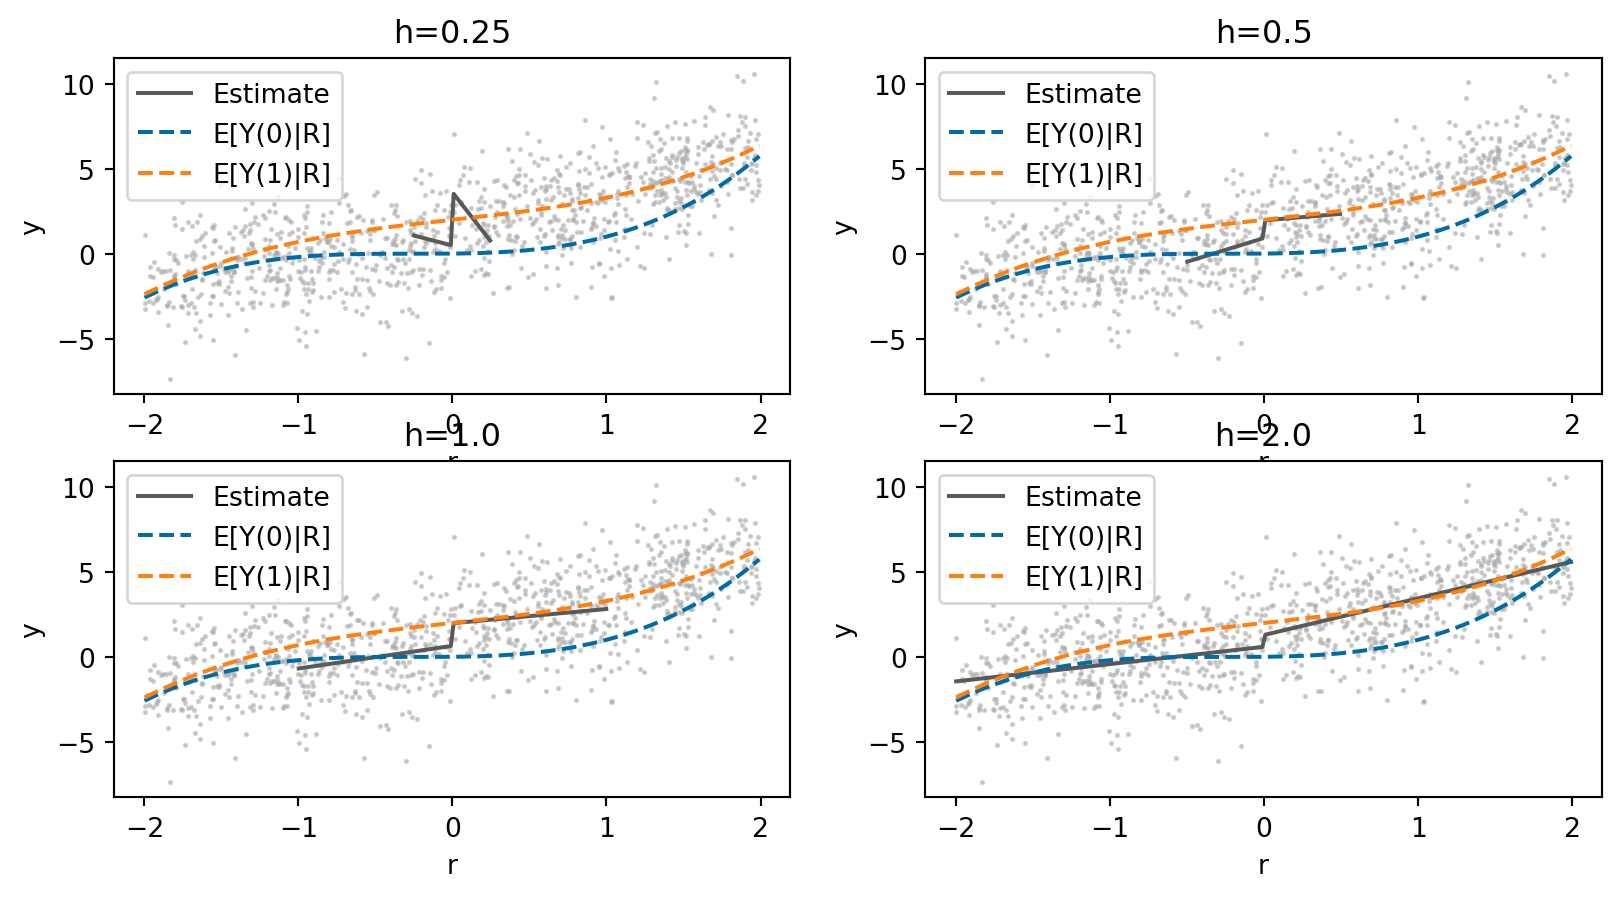
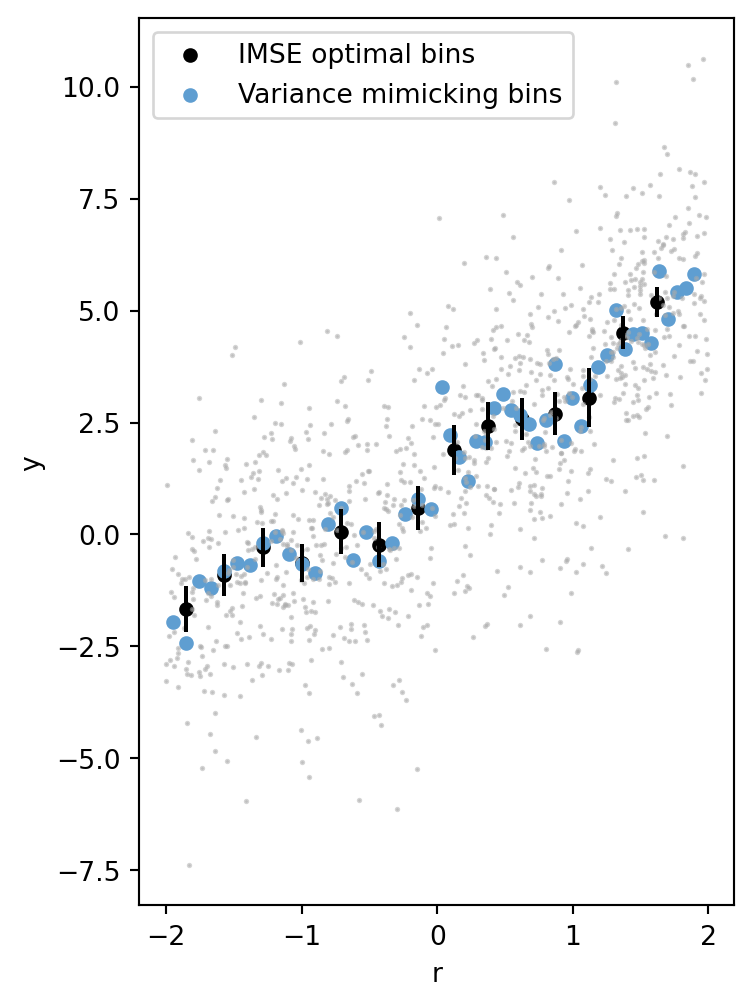
def plotey(ax,Ey,pdr) :
r = np.linspace(-2,-0.01,100)
ax.plot(r, list(map(lambda r: Ey(0,r),r)), color='C0', label="E[Y(0)|R]")
r = np.linspace(2,0.01,100)
ax.plot(r, list(map(lambda r: Ey(0,r),r)), color='C0', linestyle=":")
r = np.linspace(-2,-0.01,100)
ax.plot(r, list(map(lambda r: Ey(1,r),r)), color='C1', linestyle=":")
r = np.linspace(2,0.01,100)
ax.plot(r, list(map(lambda r: Ey(1,r),r)), color='C1', label="E[Y(1)|R]")
r = np.linspace(-2,2,200)
ax.plot(r,list(map(lambda r: pdr(r)*Ey(1,r) + (1-pdr(r))*Ey(0,r),r)), color='C2', label="E[Y|R]", linestyle="--", alpha=0.8)
ax.legend()
ax.set_xlabel('R')
ax.set_ylabel('E[Y(d)|R]')
return(ax)
ax[1] = plotey(ax[1],Ey,pdr)