Linear Regression with Real Data

ECON526

Paul Schrimpf

University of British Columbia

AI Usage

These slides were entirely generated by Deepseek V4.1 Flash. See regression_realdata_v1 for the original version. For these, I had GLM 5.3 Flash critique the original slides and then Deepseek V4.1 Flash revise them. They are better, but still not very good.

Real-Data Examples

Why Replace the Synthetic Examples?

  • The synthetic examples in regression.qmd were constructed by design and sized for illustration. This deck re-runs the same lessons on published datasets that can be traced and cited.
  • This deck uses four published replication datasets to illustrate:
    1. bad controls, mediators, and colliders;
    2. stratified randomization when treatment probabilities and treatment effects vary;
    3. why stratified/saturated regression can reduce standard errors in an RCT;
    4. a real-data sign reversal from omitted scale/population.
  • Standard errors are HC3 unless observations are clustered: we cluster by ethnic group in the Nunn–Wantchekon data and by school in STAR.
  • The examples are deliberately chosen so that the data and the original paper can be traced and cited.

The Four Datasets

Dataset Paper Main use here
Afrobarometer + slave exports Nunn and Wantchekon (2011b) bad control / mediator
Oregon Health Insurance Experiment Finkelstein et al. (2012) treatment probabilities, weighting, and effect heterogeneity
Project STAR Krueger (1999); Achilles et al. (2008) stratified regression and SEs
German city associations Satyanath et al. (2017a) sign reversal from omitted scale

Data Sources and Redistribution

Dataset Source Redistribute in this repo?
Nunn–Wantchekon AEA/openICPSR, doi:10.3886/E112479V1; public mirror used by the code No. The raw .dta is not committed. The code downloads it from a public course mirror; the original replication package is the citation above.
OHIE Harvard Dataverse, doi:10.7910/DVN/SJG1ED Yes, for the small processed extract. Original is CC0 with additional terms: no commercial use, no re-identification, and cite the data.
Project STAR Harvard Dataverse, doi:10.7910/DVN/SIWH9F Yes. CC0; a processed extract is included.
Bowling for Fascism Harvard Dataverse, doi:10.7910/DVN/EE6I7N Yes. CC0; a processed extract is included.

Bad Controls, Mediators, and Colliders

Nunn and Wantchekon (2011)

  • Question: did the transatlantic and Indian Ocean slave trades leave a legacy of mistrust in Africa?
  • Treatment: ln_export_area, log slave exports per historical ethnic-group area.
  • Outcome: trust in the local government council.
  • Candidate control: perceived performance/quality of the local council.
Code
import os
import numpy as np
import pandas as pd
import requests
import statsmodels.formula.api as smf
import matplotlib.pyplot as plt

nunn_path = "data/replication/Nunn_Wantchekon_AER_2011.dta"
nunn_url = ("https://raw.githubusercontent.com/iqss/prefresher/"
            "4e97fcafa50093a46a24c5aa5134562190740d40/"
            "data/input/Nunn_Wantchekon_AER_2011.dta")
if not os.path.exists(nunn_path):
    r = requests.get(nunn_url, timeout=60)
    r.raise_for_status()
    with open(nunn_path, "wb") as f:
        f.write(r.content)

nunn = pd.read_stata(nunn_path)
assert nunn.shape[0] > 20_000, "unexpected Nunn-Wantchekon extract"
for c in ["isocode", "occupation", "religion", "living_conditions", "education"]:
    nunn[c] = nunn[c].astype("category")

nunn_vars = [
    "trust_local_council", "ln_export_area", "age", "age2", "male", "urban_dum",
    "occupation", "religion", "living_conditions", "education",
    "isocode", "district", "ethnicity",
    "local_council_performance", "council_listen", "corrupt_local_council",
]
nunn_d = nunn.dropna(subset=nunn_vars).copy()

Nunn and Wantchekon (2011)

  • What happens when we add local-council quality?
  • If council quality is a mediator, the coefficient is no longer the total effect.
  • If council quality is a collider, conditioning opens a non-causal path; see Schneider (2020) for this concern in economic history.
Code
nunn_models = {
    "(1) bivariate": "trust_local_council ~ ln_export_area",
    "(2) + individual controls": (
        "trust_local_council ~ ln_export_area + age + age2 + male + urban_dum "
        "+ C(occupation) + C(religion) + C(living_conditions) + C(education)"
    ),
    "(3) + country FE": (
        "trust_local_council ~ ln_export_area + age + age2 + male + urban_dum "
        "+ C(occupation) + C(religion) + C(living_conditions) + C(education) "
        "+ C(isocode)"
    ),
    "(4) + council performance": (
        "trust_local_council ~ ln_export_area + age + age2 + male + urban_dum "
        "+ C(occupation) + C(religion) + C(living_conditions) + C(education) "
        "+ C(isocode) + local_council_performance"
    ),
    "(5) + all council quality": (
        "trust_local_council ~ ln_export_area + age + age2 + male + urban_dum "
        "+ C(occupation) + C(religion) + C(living_conditions) + C(education) "
        "+ C(isocode) + local_council_performance + council_listen "
        "+ corrupt_local_council"
    ),
}
nunn_rows = []
for name, form in nunn_models.items():
    m = smf.ols(form, data=nunn_d).fit(
        cov_type="cluster", cov_kwds={"groups": nunn_d["ethnicity"]}
    )
    nunn_rows.append({
        "Specification": name,
        "Coefficient on ln(exports)": m.params["ln_export_area"],
        "SE": m.bse["ln_export_area"],
        "N": int(m.nobs),
    })
nunn_table = pd.DataFrame(nunn_rows).set_index("Specification")
print(nunn_table.round(3).to_markdown())
| Specification             |   Coefficient on ln(exports) |    SE |     N |
|:--------------------------|-----------------------------:|------:|------:|
| (1) bivariate             |                       -0.152 | 0.061 | 15748 |
| (2) + individual controls |                       -0.131 | 0.044 | 15748 |
| (3) + country FE          |                       -0.113 | 0.02  | 15748 |
| (4) + council performance |                       -0.077 | 0.016 | 15748 |
| (5) + all council quality |                       -0.059 | 0.015 | 15748 |

Nunn and Wantchekon (2011): Interpretation

  • The coefficient declines monotonically: \(-0.152 \to -0.131 \to -0.113 \to -0.077 \to -0.059\).
  • Columns (1)–(3) add individual controls and country fixed effects. Columns (4)–(5) add the council-quality measures.
  • The total effect of the slave trade includes any effect operating through local institutions. Holding council quality fixed changes the estimand from a total effect to a direct effect, and it can also open a collider path if unobserved local public goods affect both council quality and trust.
  • The decline is consistent with mediation, but it is also consistent with omitted variables. Distinguishing the two requires more than coefficient stability; Nunn and Wantchekon (2011b) use instrumental variables and additional outcomes.
  • All columns use a common sample (N = 15,748). The unrestricted bivariate estimate is \(-0.144\) (SE 0.062, N = 20,210). We cluster by ethnic group because slave-export exposure varies at that level.
  • This is the real-data version of the “bad control” warning: more controls are not always better.

Stratified Randomization and Treatment Effects

Oregon Health Insurance Experiment

  • Lottery-based Medicaid expansion in Oregon.
  • Treatment: selected in the lottery.
  • Outcome: any doctor visit in the in-person survey.
  • Randomization was not i.i.d. across household sizes: lottery odds varied with the number of eligible household members.
Code
ohie = pd.read_csv("data/replication/ohie_analysis.csv")
ohie = ohie.dropna(subset=["doc_any", "treatment", "numhh", "weight"]).copy()
ohie["numhh"] = ohie["numhh"].astype(int)

prob_table = (
    ohie.groupby("numhh")
    .agg(P_treated=("treatment", "mean"), N=("treatment", "size"))
    .reset_index()
)
print(prob_table.round(3).to_markdown(index=False))

ohie_effects = []
for h in sorted(ohie["numhh"].unique()):
    g = ohie[ohie["numhh"] == h]
    m = smf.wls("doc_any ~ treatment", data=g, weights=g["weight"]).fit(cov_type="HC3")
    ci = m.conf_int().loc["treatment"]
    ohie_effects.append({
        "Household size": h,
        "Effect on P(doctor visit)": m.params["treatment"],
        "SE": m.bse["treatment"],
        "CI low": ci.iloc[0],
        "CI high": ci.iloc[1],
        "N": int(m.nobs),
    })
print("\n" + pd.DataFrame(ohie_effects).round(3).to_markdown(index=False))
|   numhh |   P_treated |    N |
|--------:|------------:|-----:|
|       1 |       0.493 | 9235 |
|       2 |       0.613 | 2952 |
|       3 |       0.889 |   18 |

|   Household size |   Effect on P(doctor visit) |    SE |   CI low |   CI high |    N |
|-----------------:|----------------------------:|------:|---------:|----------:|-----:|
|                1 |                       0.036 | 0.011 |    0.016 |     0.057 | 9235 |
|                2 |                       0.051 | 0.021 |    0.009 |     0.093 | 2952 |
|                3 |                       0.161 | 0.721 |   -1.251 |     1.573 |   18 |

Oregon Health Insurance Experiment

  • Simple difference versus adjustment for household size.
  • All estimates use the in-person survey weights and are ITT effects of lottery selection, not effects of Medicaid: take-up is about 43% among selected households and 19% among non-selected households.
Code
ohie_models = {
    "Simple difference": "doc_any ~ treatment",
    "+ household size": "doc_any ~ treatment + C(numhh)",
}
ohie_rows = []
for name, form in ohie_models.items():
    m = smf.wls(form, data=ohie, weights=ohie["weight"]).fit(cov_type="HC3")
    ohie_rows.append({
        "Specification": name,
        "Effect": m.params["treatment"],
        "SE": m.bse["treatment"],
        "N": int(m.nobs),
    })
print(pd.DataFrame(ohie_rows).set_index("Specification").round(4).to_markdown())
| Specification     |   Effect |     SE |     N |
|:------------------|---------:|-------:|------:|
| Simple difference |   0.0352 | 0.0095 | 12205 |
| + household size  |   0.04   | 0.0096 | 12205 |

Oregon Health Insurance Experiment: What Is the Lesson?

  • \(P(D=1\mid X)\) varies with household size: about 0.49, 0.61, and 0.89 in the analysis sample for one-, two-, and three-person households.
  • The 1- and 2-person effects are similar in magnitude (about 3.6 and 5.1 percentage points, with wide confidence intervals); the 3+ estimate rests on only 18 observations and is too imprecise to interpret.
  • Both the unadjusted and adjusted estimates are consistent in this stratified RCT; they differ because they weight stratum-specific effects differently.
  • The unadjusted estimate is closer to a variance-weighted average of stratum effects: \[ \hat\tau_{\text{unadj}} = \sum_h v_h \hat\tau_h, \qquad v_h = \frac{P(X=h)\,\mathrm{Var}(D\mid X=h)}{\sum_{h'} P(X=h')\,\mathrm{Var}(D\mid X=h')}. \]
  • Adjusting for household size changes the estimand and the weights, not the validity of the experiment.
  • In an observational study, the same uneven \(P(D\mid X)\) combined with selection on \(X\) would also bias the unadjusted estimate. Randomization is what rules out that bias here.
  • Here numhh is a good control: it is pre-treatment and determines treatment probabilities. It is not a mediator.
  • The in-person survey is a subsample; doc_any is missing for only about 0.2% of respondents after restricting to survey respondents.

Stratified Regression and Standard Errors

Project STAR

  • Tennessee class-size experiment: students were randomized to small classes, regular classes, or regular classes with a teacher’s aide.
  • Outcome: kindergarten reading score.
  • Treatment: small class versus regular class (aide classes omitted for this comparison).
  • School is a randomization stratum; baseline covariates are available.
Code
star = pd.read_csv("data/replication/star_k.csv")
star = star[star["classtype"].isin([1, 2])].copy()
star["small"] = (star["classtype"] == 1).astype(int)
star = star.dropna(subset=["read", "small", "school", "gender", "race", "freelunch"])

star_models = {
    "Simple difference": "read ~ small",
    "+ school FE": "read ~ small + C(school)",
    "+ school FE + covariates": "read ~ small + C(school) + C(gender) + C(race) + C(freelunch)",
}
star_rows = []
for name, form in star_models.items():
    m = smf.ols(form, data=star).fit(
        cov_type="cluster", cov_kwds={"groups": star["school"]}
    )
    star_rows.append({
        "Specification": name,
        "Effect of small class": m.params["small"],
        "SE": m.bse["small"],
        "N": int(m.nobs),
    })
print(pd.DataFrame(star_rows).set_index("Specification").round(3).to_markdown())
| Specification            |   Effect of small class |    SE |    N |
|:-------------------------|------------------------:|------:|-----:|
| Simple difference        |                   5.899 | 1.851 | 3733 |
| + school FE              |                   6.702 | 1.784 | 3733 |
| + school FE + covariates |                   6.649 | 1.717 | 3733 |

Project STAR: Interpretation

  • The point estimate is stable at roughly 6–7 points.
  • Controlling for the randomization stratum (school) and baseline covariates reduces the clustered standard error by about 7 percent.
  • That is the intuition behind saturated/stratified regression in an RCT: removing predictable between-stratum variation in outcomes sharpens the treatment contrast.
  • STAR randomizes students and teachers within schools, so we cluster by school. With many strata, fully interacting treatment with every stratum can be noisy; additive stratum effects are often the practical compromise.

A Real Sign Reversal

Bowling for Fascism

  • Satyanath et al. (2017a) study 229 German towns and cities in the 1920s.
  • Treatment: association density (clubs per capita).
  • The paper’s outcome is the per-capita standardized Nazi Party entry rate, pcNSentry_std.
  • Association density is not randomized, so these are conditional associations, not causal effects.
  • On the paper’s own outcome, the association is positive and stable:
Code
bowling = pd.read_csv("data/replication/bowling_cities.csv")

paper_models = {
    "Bivariate": "pcNSentry_std ~ clubs_all_pc",
    "+ log population": "pcNSentry_std ~ clubs_all_pc + lnpop",
    "+ population controls": (
        "pcNSentry_std ~ clubs_all_pc + lnpop + share_cath25 "
        "+ bcollar25 + share_jew25"
    ),
}
paper_rows = []
for name, form in paper_models.items():
    m = smf.ols(form, data=bowling).fit(cov_type="HC3")
    paper_rows.append({
        "Specification": name,
        "Effect": m.params["clubs_all_pc"],
        "SE": m.bse["clubs_all_pc"],
        "N": int(m.nobs),
    })
print(pd.DataFrame(paper_rows).set_index("Specification").round(3).to_markdown())
| Specification         |   Effect |    SE |   N |
|:----------------------|---------:|------:|----:|
| Bivariate             |    0.126 | 0.052 | 229 |
| + log population      |    0.197 | 0.061 | 229 |
| + population controls |    0.162 | 0.055 | 227 |

A Sign Reversal from Mismatching Units

  • Now replace the per-capita outcome with the total number of Nazi entries, NSentry_total.
  • The treatment is still clubs per capita. This mismatch produces a sign reversal:
Code
count_models = {
    "Bivariate": "NSentry_total ~ clubs_all_pc",
    "+ log population": "NSentry_total ~ clubs_all_pc + lnpop",
    "+ population controls": (
        "NSentry_total ~ clubs_all_pc + lnpop + share_cath25 "
        "+ bcollar25 + share_jew25"
    ),
}
count_rows = []
for name, form in count_models.items():
    m = smf.ols(form, data=bowling).fit(cov_type="HC3")
    count_rows.append({
        "Specification": name,
        "Effect": m.params["clubs_all_pc"],
        "SE": m.bse["clubs_all_pc"],
        "N": int(m.nobs),
    })
print(pd.DataFrame(count_rows).set_index("Specification").round(3).to_markdown())
| Specification         |   Effect |    SE |   N |
|:----------------------|---------:|------:|----:|
| Bivariate             |  -16.399 | 3.271 | 229 |
| + log population      |    6.967 | 2.589 | 229 |
| + population controls |    6.682 | 2.698 | 227 |

A Sign Reversal from Mismatching Units

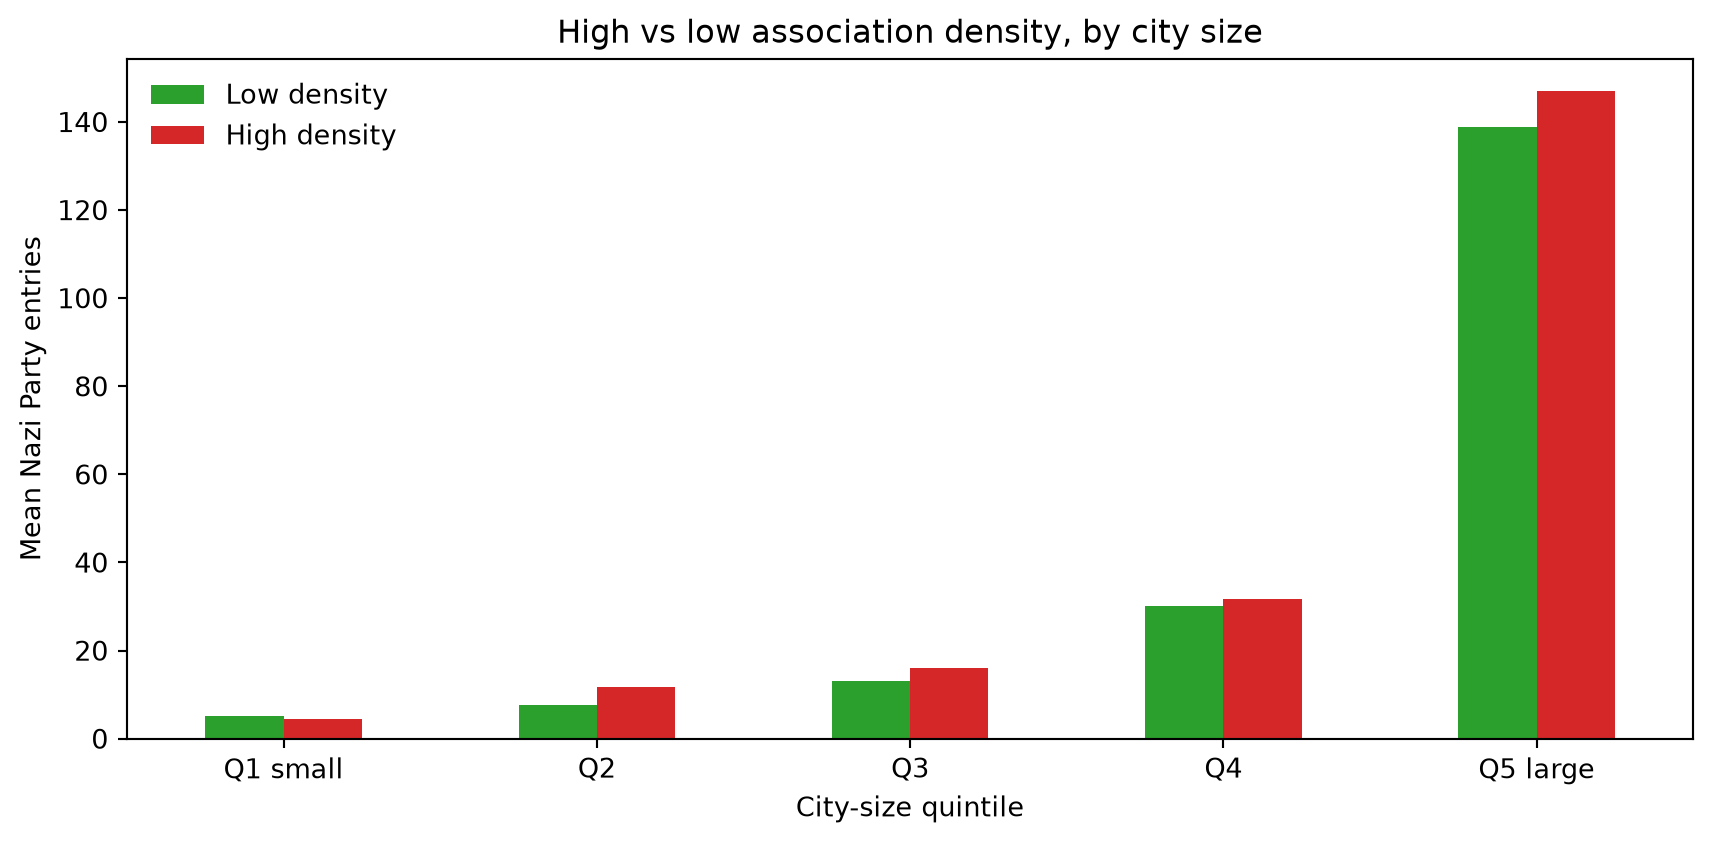
Code
bowling["high_clubs"] = (bowling["clubs_all_pc"] >
                         bowling["clubs_all_pc"].median()).astype(int)
bowling["pop_quintile"] = pd.qcut(
    bowling["lnpop"], 5, labels=["Q1 small", "Q2", "Q3", "Q4", "Q5 large"]
)
means = (
    bowling.groupby(["pop_quintile", "high_clubs"], observed=True)["NSentry_total"]
    .mean()
    .unstack()
)
print(means.round(1).to_markdown())

fig, ax = plt.subplots(figsize=(9, 4.5))
means.plot(kind="bar", ax=ax, color=["C2", "C3"])
ax.set_xlabel("City-size quintile")
ax.set_ylabel("Mean Nazi Party entries")
ax.set_title("High vs low association density, by city size")
ax.legend(["Low density", "High density"], frameon=False)
plt.xticks(rotation=0)
plt.tight_layout()
plt.show()
| pop_quintile   |     0 |     1 |
|:---------------|------:|------:|
| Q1 small       |   5.1 |   4.5 |
| Q2             |   7.6 |  11.6 |
| Q3             |  13.2 |  16.1 |
| Q4             |  30   |  31.6 |
| Q5 large       | 138.9 | 147   |

Bowling for Fascism: What the Reversal Teaches

  • The count outcome reverses from about \(-16.4\) to \(+7.0\) once log population is included.
  • Association density is much higher in small towns, and small towns have far fewer total entries; the bivariate result is driven by city size, not by a negative effect of associations.
  • In four of the five city-size quintiles, high-density towns have more Nazi entries.
  • This is a real sign reversal, but it is an omitted-variable/scale reversal, not the best-linear-approximation pathology on the Caution slide of regression.qmd. The synthetic Caution example remains the clean illustration of that distinct phenomenon.
  • Lesson: match the outcome units to the estimand. Regressing a total on a per-capita treatment without controlling for population produces a misleading sign.
  • This is the omitted-variable formula from the Omitted Variables slide: population is the omitted \(w\), and it is strongly negatively correlated with clubs per capita.
  • The paper’s conclusion, using the per-capita outcome, is that denser social networks were associated with faster Nazi Party entry.

Data Appendix

Reproducing the Extracts

Code
sources = pd.DataFrame([
    {
        "Dataset": "Nunn--Wantchekon",
        "Local file": "data/replication/Nunn_Wantchekon_AER_2011.dta",
        "Original source": "https://doi.org/10.3886/E112479V1",
        "Redistributed": "No",
    },
    {
        "Dataset": "OHIE",
        "Local file": "data/replication/ohie_analysis.csv",
        "Original source": "https://doi.org/10.7910/DVN/SJG1ED",
        "Redistributed": "Yes (processed extract; CC0 + terms)",
    },
    {
        "Dataset": "Project STAR",
        "Local file": "data/replication/star_k.csv",
        "Original source": "https://doi.org/10.7910/DVN/SIWH9F",
        "Redistributed": "Yes (processed extract; CC0)",
    },
    {
        "Dataset": "Bowling for Fascism",
        "Local file": "data/replication/bowling_cities.csv",
        "Original source": "https://doi.org/10.7910/DVN/EE6I7N",
        "Redistributed": "Yes (processed extract; CC0)",
    },
])
print(sources.to_markdown(index=False))
| Dataset             | Local file                                    | Original source                    | Redistributed                        |
|:--------------------|:----------------------------------------------|:-----------------------------------|:-------------------------------------|
| Nunn--Wantchekon    | data/replication/Nunn_Wantchekon_AER_2011.dta | https://doi.org/10.3886/E112479V1  | No                                   |
| OHIE                | data/replication/ohie_analysis.csv            | https://doi.org/10.7910/DVN/SJG1ED | Yes (processed extract; CC0 + terms) |
| Project STAR        | data/replication/star_k.csv                   | https://doi.org/10.7910/DVN/SIWH9F | Yes (processed extract; CC0)         |
| Bowling for Fascism | data/replication/bowling_cities.csv           | https://doi.org/10.7910/DVN/EE6I7N | Yes (processed extract; CC0)         |

Data Notes

  • Nunn–Wantchekon: the raw file is not redistributed. The code downloads the public IQSS mirror; the authoritative replication package is Nunn and Wantchekon (2011a) at openICPSR. If you need to download it manually, use the DOI and place the file at data/replication/Nunn_Wantchekon_AER_2011.dta.
  • OHIE: the processed extract keeps only analysis variables and drops direct identifiers. The original is CC0 with additional terms: no commercial use, no re-identification, and citation of Finkelstein and Baicker (2012). Terms checked against the Dataverse record on 2026-11-03; see the record for the full terms. To obtain the raw public-use zip, download it from the Dataverse record (accepting the guestbook) or from NBER (login may be required).
  • Project STAR: CC0. The processed extract is star_k.csv; the original deposit is Achilles et al. (2008).
  • Bowling for Fascism: CC0. The processed extract is bowling_cities.csv; the original deposit is Satyanath et al. (2017b).
  • The script data/replication/prepare_data.py rebuilds the three processed extracts from the raw files. See data/replication/README.md for the download steps.

Source Citations

  • Nunn and Wantchekon (2011b); replication package: Nunn and Wantchekon (2011a).
  • Finkelstein et al. (2012); data: Finkelstein and Baicker (2012).
  • Krueger (1999); data: Achilles et al. (2008).
  • Satyanath et al. (2017a); data: Satyanath et al. (2017b).

References

Achilles, C. M., H. P. Bain, F. Bellott, et al. 2008. Tennessee’s Student Teacher Achievement Ratio (STAR) Project. Harvard Dataverse. https://doi.org/10.7910/DVN/SIWH9F.
Finkelstein, Amy, and Katherine Baicker. 2012. Oregon Health Insurance Experiment: Public Use Data. Harvard Dataverse. https://doi.org/10.7910/DVN/SJG1ED.
Finkelstein, Amy, Sarah Taubman, Bill Wright, et al. 2012. “The Oregon Health Insurance Experiment: Evidence from the First Year.” Quarterly Journal of Economics 127 (3): 1057–106. https://doi.org/10.1093/qje/qjs020.
Krueger, Alan B. 1999. “Experimental Estimates of Education Production Functions.” Quarterly Journal of Economics 114 (2): 497–532. https://doi.org/10.1162/003355399556052.
Nunn, Nathan, and Leonard Wantchekon. 2011a. Replication Data for: The Slave Trade and the Origins of Mistrust in Africa. AEA Data and Code Repository, openICPSR. https://doi.org/10.3886/E112479V1.
Nunn, Nathan, and Leonard Wantchekon. 2011b. “The Slave Trade and the Origins of Mistrust in Africa.” American Economic Review 101 (7): 3221–52. https://doi.org/10.1257/aer.101.7.3221.
Satyanath, Shanker, Nico Voigtländer, and Hans-Joachim Voth. 2017a. “Bowling for Fascism: Social Capital and the Rise of the Nazi Party.” Journal of Political Economy 125 (2): 478–526. https://doi.org/10.1086/690949.
Satyanath, Shanker, Nico Voigtländer, and Hans-Joachim Voth. 2017b. Code and Data for: Bowling for Fascism: Social Capital and the Rise of the Nazi Party. Harvard Dataverse. https://doi.org/10.7910/DVN/EE6I7N.
Schneider, Eric B. 2020. “Collider Bias in Economic History Research.” Explorations in Economic History 78: 101356. https://doi.org/10.1016/j.eeh.2020.101356.